


High Blood Pressure and Body Composition: How Visceral Fat and Muscle Mass Affect Hypertension Risk
Nearly half of all adults in the United Kingdom live with high blood pressure, yet many have no idea their body composition plays a central role in their risk. Standard body mass index measurements can miss the picture entirely. Two people with identical BMIs can have vastly different blood pressure profiles depending on how much visceral fat they carry and how much lean muscle tissue they have.
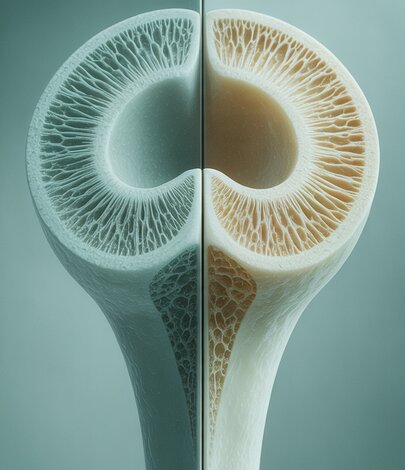
A body composition DEXA scan measures exactly where fat sits in your body and how much muscle mass you carry in each region. This level of detail goes far beyond what a bathroom scale or BMI chart can offer, and it has direct implications for understanding and managing hypertension risk.
Quick Answer: Research from the UK Biobank confirms that visceral fat is the primary driver of adiposity-related hypertension, accounting for 65 to 78 percent of primary high blood pressure cases. A DEXA scan quantifies visceral adipose tissue, android-to-gynoid fat ratio, and regional lean mass, giving you and your doctor a precise picture of your cardiovascular risk that weight alone cannot provide.
Why Blood Pressure and Body Composition Are Connected
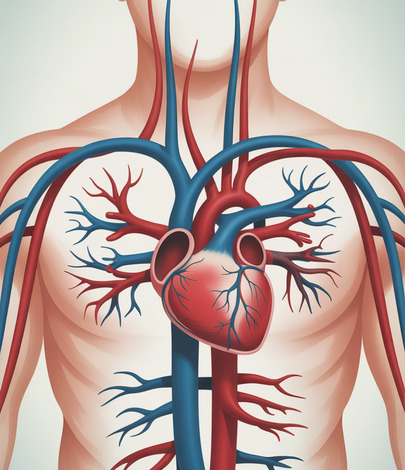
The relationship between excess body fat and elevated blood pressure has been understood for decades, but the mechanisms are more complex than simply carrying extra weight. Obesity drives hypertension through several overlapping pathways.
Excess adipose tissue activates the sympathetic nervous system, which increases heart rate and constricts blood vessels. It stimulates the renin-angiotensin-aldosterone system (RAAS), causing the kidneys to retain sodium and water. It promotes insulin resistance, which further impairs vascular function. And it releases inflammatory cytokines, including interleukin-6 and tumour necrosis factor-alpha, that damage blood vessel walls over time (Shariq et al., Gland Surgery, 2020).
What matters most, however, is not total body weight but where that fat is stored and how it interacts with your lean tissue. This is why body composition assessment has become increasingly important in cardiovascular risk stratification.
How Visceral Fat Drives Hypertension
Visceral adipose tissue (VAT) is the fat stored deep within the abdominal cavity, surrounding your liver, kidneys, and intestines. Unlike subcutaneous fat beneath the skin, visceral fat is metabolically active and directly contributes to elevated blood pressure through several distinct mechanisms.
Excess visceral fat around the kidneys increases intra-abdominal pressure, compressing the renal veins, lymph vessels, and parenchyma. This physical compression impairs kidney function and reduces the kidneys’ ability to regulate sodium and fluid balance, leading to sustained blood pressure elevation (Neeland et al., UK Biobank study, 2019).
Visceral fat also secretes higher concentrations of pro-inflammatory cytokines compared to subcutaneous fat. These substances disrupt insulin signalling and promote arterial stiffness, both of which contribute to hypertension. A study in the journal Hypertension found that reductions in visceral fat area correlated directly with blood pressure improvements, even when total body weight remained relatively unchanged (Kanai et al., Hypertension, 1996).
This is why two individuals with the same BMI can have dramatically different blood pressure readings. The person carrying more visceral fat will almost always face greater hypertension risk, regardless of what the scales say.
The Role of Muscle Mass in Blood Pressure Regulation
While the link between excess fat and high blood pressure is well established, emerging research suggests that skeletal muscle mass plays an independent role in blood pressure regulation. A 2023 prospective cohort study published in Frontiers in Nutrition found that higher relative skeletal muscle mass was associated with reduced hypertension risk, even after adjusting for body fat levels (Park et al., Frontiers in Nutrition, 2023).
The mechanisms behind this protective effect are still being investigated, but several explanations have been proposed. Skeletal muscle acts as an endocrine organ, secreting myokines that improve insulin sensitivity, reduce inflammation, and support healthy vascular function. Reduced muscle mass has also been linked to increased arterial stiffness, a precursor to hypertension in younger adults and patients with metabolic conditions.
A large cross-sectional analysis of over 50,000 NHANES participants found that higher lean body mass was associated with lower odds of hypertension (Li et al., Journal of Clinical Hypertension, 2023). This finding suggests that preserving muscle through resistance training and adequate protein intake may offer cardiovascular benefits beyond metabolic health alone.
However, the evidence is not entirely straightforward. A 2024 systematic review noted conflicting results across different populations, with age, sex, ethnicity, and body fat distribution all influencing the relationship between muscle mass and blood pressure. This complexity underscores why a detailed body composition assessment is more informative than any single measurement.
What Your DEXA Scan Reveals About Hypertension Risk
A DEXA (dual-energy X-ray absorptiometry) scan provides a three-compartment analysis of your body, separating fat mass, lean mass, and bone mineral content across different regions. For hypertension risk assessment, several specific metrics are particularly valuable.
Visceral adipose tissue (VAT) mass. DEXA quantifies the mass of fat stored in your android (abdominal) region and estimates visceral fat specifically. This is the single strongest body composition predictor of hypertension risk, and it cannot be reliably measured by waist circumference alone.
Regional fat distribution. DEXA maps how fat is distributed across your trunk, arms, and legs. Central fat accumulation in the trunk region carries significantly higher cardiovascular risk than peripheral fat stored in the limbs.
Lean mass by region. The scan reports lean tissue mass for each limb and the trunk separately, allowing clinicians to identify low muscle mass (sarcopenia) or asymmetric muscle loss that may compound metabolic risk.
Total body fat percentage. While less specific than regional measurements, total body fat percentage provides important context. Current UK guidelines align with the 2025 updated obesity definition, which factors in body fat percentage alongside BMI and waist circumference.
Together, these metrics create a detailed map of your metabolic risk profile that blood pressure readings alone cannot provide. A patient with borderline hypertension and high visceral fat, for example, may need a more aggressive intervention strategy than someone with the same blood pressure but healthy body composition.
Android to Gynoid Ratio and Cardiovascular Health
One of the most clinically useful measurements from a DEXA scan is the android-to-gynoid (A/G) fat ratio. The android region covers the abdomen and lower chest, while the gynoid region covers the hips and upper thighs. A higher A/G ratio indicates that a greater proportion of your fat is stored centrally rather than peripherally.
Research has consistently shown that the A/G ratio correlates more strongly with cardiometabolic risk factors than BMI, total body fat percentage, or even waist circumference. A 2024 study in postmenopausal women found positive correlations between the A/G ratio and systolic blood pressure (r = 0.273), triglycerides (r = 0.367), and 10-year cardiovascular disease risk (r = 0.277) (Medicina, 2024).
Gynoid (hip and thigh) fat, by contrast, appears to have a protective association for cardiovascular risk markers, including a healthier lipid profile and reduced insulin resistance. This explains why fat redistribution from the hips to the abdomen during perimenopause and andropause often coincides with rising blood pressure.
We explored how DEXA measures this ratio and what it means for heart disease risk in our guide to the android to gynoid fat ratio and cardiovascular risk. If your A/G ratio is elevated, it is worth discussing both blood pressure monitoring and targeted fat reduction strategies with your GP.
How Weight Loss Affects Blood Pressure: What the Evidence Shows
The evidence linking weight loss to blood pressure reduction is robust. A review published in the journal Circulation found that for every kilogram of body weight lost through lifestyle intervention, systolic blood pressure drops by approximately 1 mmHg. A weight reduction of 5 to 10 percent can lower systolic blood pressure by more than 5 mmHg and diastolic pressure by more than 4 mmHg (Weight Loss Therapies and Hypertension Benefits, PMC, 2024).
Crucially, the type of tissue lost matters as much as the total weight. A landmark study in the journal Hypertension demonstrated that changes in blood pressure after weight reduction correlated with the reduction in visceral fat area, not with changes in total body weight or BMI. A decrease of approximately 37 cm squared in visceral fat produced an average systolic blood pressure reduction of 8.2 mmHg and a diastolic reduction of 4.6 mmHg.
This is where serial DEXA scanning becomes particularly valuable. Tracking body composition over time allows you and your clinician to confirm that fat loss is coming from the visceral compartment rather than from lean muscle tissue, which would not carry the same cardiovascular benefit and could worsen metabolic health.
For patients whose DEXA results show elevated visceral fat alongside high blood pressure, a supervised weight-loss programme may be worth considering. CutKilo, the sister service to DEXA London, offers doctor-led Mounjaro (tirzepatide) treatment under the supervision of Dr Emil Gadimali. Tirzepatide has been shown to reduce visceral fat alongside total body weight, and emerging evidence suggests meaningful blood pressure improvements in treated patients. Start the CutKilo questionnaire to find out whether you may be suitable.
Frequently Asked Questions
Can a DEXA scan detect high blood pressure?
A DEXA scan does not measure blood pressure directly. What it does is identify body composition patterns, particularly high visceral fat, a high android-to-gynoid ratio, and low lean mass, that are strongly associated with hypertension risk. This information helps your doctor understand the structural drivers behind your blood pressure readings.
How much visceral fat is too much for blood pressure?
There is no single universal threshold, but research consistently shows that visceral fat area above approximately 100 cm squared is associated with significantly elevated cardiovascular risk, including hypertension. Your DEXA report will show your visceral fat mass relative to age- and sex-matched reference ranges.
Does building muscle lower blood pressure?
Emerging evidence suggests that higher skeletal muscle mass is associated with lower blood pressure, independent of body fat levels. Resistance training may improve blood pressure through enhanced insulin sensitivity, reduced arterial stiffness, and the release of anti-inflammatory myokines. However, the relationship is complex and varies by age, sex, and ethnicity.
How often should I get a DEXA scan if I have high blood pressure?
If you are actively working to reduce your blood pressure through weight loss or lifestyle changes, a follow-up scan every three to six months can help confirm that you are losing visceral fat rather than muscle. If your blood pressure is well controlled and your body composition is stable, an annual scan is usually sufficient.
Is BMI a good indicator of blood pressure risk?
BMI provides a rough population-level indicator but is poor at predicting individual cardiovascular risk. It cannot distinguish between fat and muscle, nor can it identify visceral fat accumulation. Two people with a BMI of 28 may have very different blood pressure profiles depending on their body composition. DEXA scanning provides the detail that BMI lacks.
Book Your DEXA Scan at Our Harley Street Clinic
Understanding your body composition is one of the most practical steps you can take to assess and manage your blood pressure risk. At DEXA London, our Harley Street clinic offers clinical-grade DEXA body composition and bone density scanning with results reviewed by a doctor.
Your scan takes approximately 12 minutes and provides a detailed breakdown of fat mass, lean mass, bone density, visceral fat, and regional distribution. You will receive a full report with personalised interpretation to share with your GP or specialist.
To book your scan, call us on 0207 637 8227 or visit our body composition DEXA scan page to learn more about what the scan involves.
Dr Emil Gadimali